MPAndroidChat的PieChart和BarChart学习_mpandroidchar 动画-程序员宅基地
技术标签: android应用开发
先把要写的写下来,有时间再详写
之前学MPAndroidChat主要看了这个人的博文http://blog.csdn.net/shineflowers/article/details/44809119,但是发现和github上的内容有出入,仔细研究了后发现github上的代码原来一直在更新,博主只是因为版本低所以不一样,所以我从github上导出工程后再导出jar包就是最新的了。
下面的中文说明http://www.jianshu.com/p/c049389d348a?nomobile=yes
---------------------------------------------------------------------------------------------------------------------------------------------------
今天算是有时间了 ,抽点时间把图表内容总结一下,有部分是copy上述引用博文的,有部分是自己总结的,代码如下:
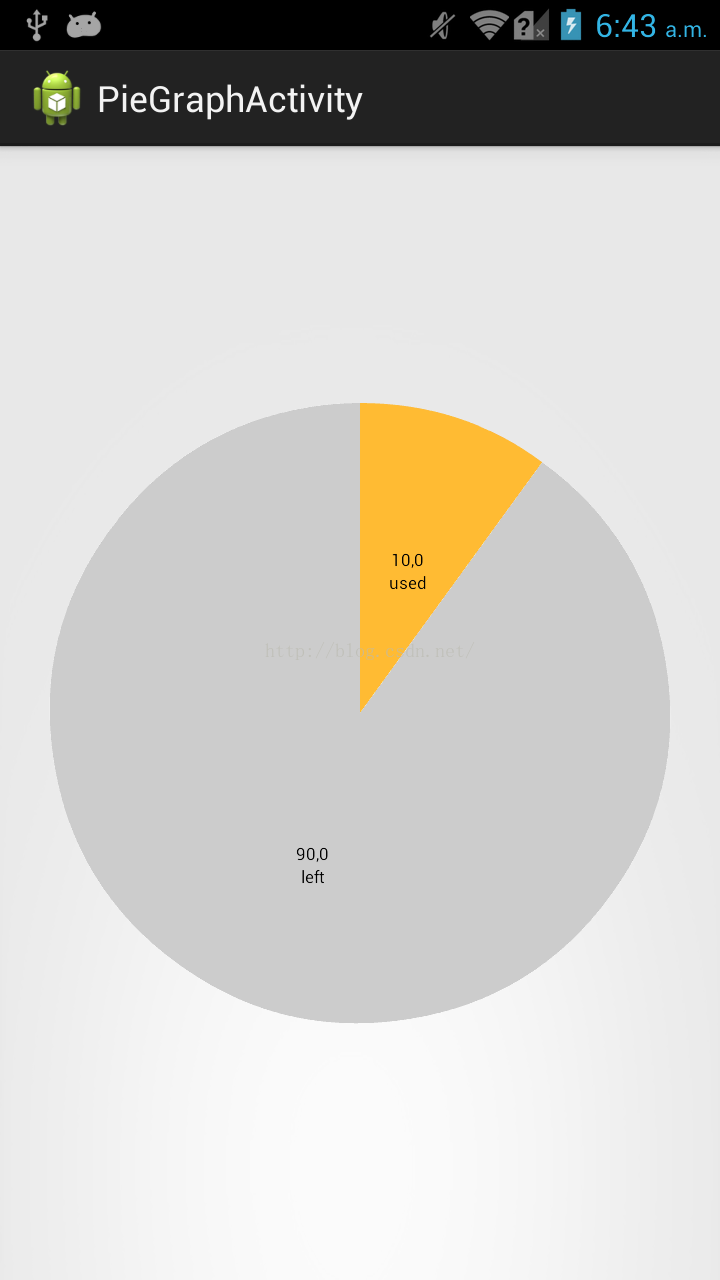
饼型图:
package myapp.charttest;

import java.util.ArrayList;

import android.app.Activity;
import android.graphics.Color;
import android.os.Bundle;

import com.github.mikephil.charting.charts.PieChart;
import com.github.mikephil.charting.components.Legend;
import com.github.mikephil.charting.data.Entry;
import com.github.mikephil.charting.data.PieData;
import com.github.mikephil.charting.data.PieDataSet;

public class PieGraphActivity extends Activity {
    PieChart pieChart;

	@Override
	protected void onCreate(Bundle savedInstanceState) {
		super.onCreate(savedInstanceState);
		setContentView(R.layout.activity_pie_graph);
		init();
		setChart();
	}

	public void init(){
		pieChart=(PieChart)findViewById(R.id.pie_chart);
	}

	public void setChart(){

		//名字
		ArrayList<String> names=new ArrayList<String>();
		names.add("used");
		names.add("left");
		//大小
		ArrayList<Entry> sizes=new ArrayList<Entry>();
		sizes.add(new Entry(10,0));
		sizes.add(new Entry(90,1));
		//颜色
		ArrayList<Integer> colors=new ArrayList<Integer>();
        colors.add(Color.parseColor("#FFBB33"));
        colors.add(Color.parseColor("#CCCCCC"));

		PieDataSet pieDataSet=new PieDataSet(sizes,"");//参数:颜色栏显示颜色目录、
		//pieDataSet.setDrawValues(false);//是否在块上面显示值以及百分百
		//pieDataSet.setSliceSpace(0f);//块间距
		pieDataSet.setColors(colors);


		//DisplayMetrics metrics=this.getResources().getDisplayMetrics();
		PieData pieData=new PieData(names,pieDataSet);


		pieChart.setTransparentCircleRadius(0f);//设置大圆里面透明小圆半径,和洞不是一个圆

		pieChart.setDrawHoleEnabled(true);
		//pieChart.setHoleColorTransparent(true);//设置中心洞是否透明:true为黑,false为白
		pieChart.setHoleRadius(0f);//设置大圆里面的无色圆的半径(洞...)


		pieChart.setDescription("");//参数:右下角显示图形描述

		pieChart.setDrawCenterText(false);//不显示图中心文字
		pieChart.setCenterText("traffic graph");//图中心文字
		pieChart.setRotationEnabled(false);//不能手动旋转

		//pieChart.setDrawMarkerViews(false);
		//pieChart.setDrawSliceText(false);//块的文本是否显示


		pieChart.setData(pieData);

		Legend legend=pieChart.getLegend();
		legend.setEnabled(false);//是否显示图形说明,必须要放在setData后,否则出错

		//两个参数有不同的意思:
		//durationMillisX:每个块运行到固定初始位置的时间
		//durationMillisY: 每个块到绘制结束时间
		pieChart.animateXY(1000, 1000);//设置动画(参数为时间)

	}


}
显示结果:
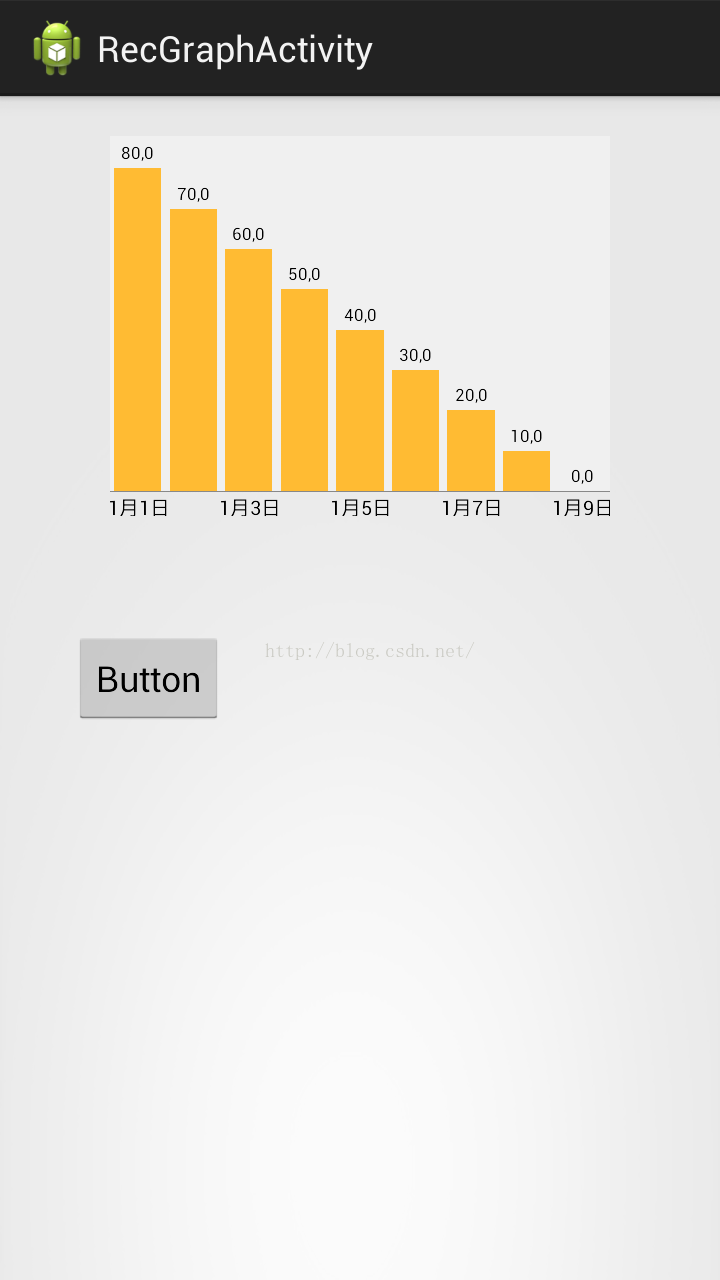
直方图:
package myapp.charttest;

import java.util.ArrayList;

import android.app.Activity;
import android.graphics.Color;
import android.os.Bundle;
import android.view.WindowManager;

import com.github.mikephil.charting.charts.BarChart;
import com.github.mikephil.charting.components.Legend;
import com.github.mikephil.charting.components.XAxis;
import com.github.mikephil.charting.components.XAxis.XAxisPosition;
import com.github.mikephil.charting.components.YAxis;
import com.github.mikephil.charting.components.YAxis.YAxisLabelPosition;
import com.github.mikephil.charting.data.BarData;
import com.github.mikephil.charting.data.BarDataSet;
import com.github.mikephil.charting.data.BarEntry;

public class RecGraphActivity extends Activity {
	BarChart barChart;

	@Override
	protected void onCreate(Bundle savedInstanceState) {
		super.onCreate(savedInstanceState);

		getWindow().setFlags(WindowManager.LayoutParams.FLAG_FULLSCREEN,
                WindowManager.LayoutParams.FLAG_FULLSCREEN);

		setContentView(R.layout.activity_rec_graph);
		init();
		setData();
	}

	public void init(){
		barChart=(BarChart)findViewById(R.id.bar_chart);
	}

	public void setData(){
		//名称
		ArrayList<String> names=new ArrayList<String>();
		names.add("1月1日");
		names.add("1月2日");
		names.add("1月3日");
		names.add("1月4日");
		names.add("1月5日");
		names.add("1月6日");
		names.add("1月7日");
		names.add("1月8日");
		names.add("1月9日");
		//大小(高低)
		ArrayList<BarEntry> sizes=new ArrayList<BarEntry>();
		sizes.add(new BarEntry(80,0));
		sizes.add(new BarEntry(70,1));
		sizes.add(new BarEntry(60,2));
		sizes.add(new BarEntry(50,3));
		sizes.add(new BarEntry(40,4));
		sizes.add(new BarEntry(30,5));
		sizes.add(new BarEntry(20,6));
		sizes.add(new BarEntry(10,7));
		sizes.add(new BarEntry(0,8));

		//颜色
		BarDataSet barDataSet=new BarDataSet(sizes,"");
		barDataSet.setColor(Color.parseColor("#FFBB33"));

		BarData barData=new BarData(names,barDataSet);

		barChart.setDescription("");//数据描述
		barChart.setNoDataTextDescription("No Data");//没有数据时显示

		//barChart.setDragEnabled(false);//拖拽(蛋疼)

		barChart.setScaleEnabled(true);//手动缩放效果
		barChart.setPinchZoom(false);//xy轴同时缩放,和setScaleEnabled一起使用

		barChart.setHighlightPerTapEnabled(true);//按下时高亮显示

		//barChart.setDrawGridBackground(false);
		//barChart.setDrawBorders(false);//画布边框

		//barChart.setVisibleXRange(7);
		//barChart.setMaxVisibleValueCount(6);
		barChart.setDrawBarShadow(false);//设置矩形阴影不显示
		barChart.setBackgroundColor(Color.parseColor("#FFFFFF"));//设置背景颜色

		barChart.setMinOffset(0);//=padding
		barChart.setDrawValueAboveBar(true);

		barChart.setData(barData);
		barChart.animateXY(1000, 1000);//设置动画

		Legend legend=barChart.getLegend();//取消图形说明
		legend.setEnabled(false);

		//获取X轴坐标
		XAxis xAxis=barChart.getXAxis();
		xAxis.setPosition(XAxisPosition.BOTTOM);//X坐标位于图标底部
		xAxis.setDrawGridLines(false);
		xAxis.setSpaceBetweenLabels(2);//设置名字names之间的间距
		//xAxis.

		//获取Y轴右坐标
		YAxis yAxisR=barChart.getAxisRight();
		yAxisR.setEnabled(false);
		yAxisR.setDrawGridLines(false);

		//获取Y轴左坐标
		YAxis yAxisL=barChart.getAxisLeft();
		yAxisL.setEnabled(false);
		yAxisL.setDrawGridLines(false);
	}
}
显示结果:
遇到的相关问题:
1:barChart的横坐标值没有显示。原因:视图中图表控件高度是match_parent,需要增加属性android:layout_marginBottom="35dp"(或者其他值)
--------------------------------------------------------------------------------------------------------------------------------------------------
大叫好,今天又有时间写博文了,之前上传了图片没看,今天一瞧真TM大,尴尬了......
嗯,继续解决上述第二个问题,今天看了一天的源代码,是在没有找到能够初始化柱子的函数,悲剧,所以只能从其他方法入手,我的想法是让柱子的总数一定,比如30天,有30个数据,但是我要它只显示7个数据,我们可以让直方图放大四倍,这样显示在屏幕上的就是7个数据了,好了有了目标就可以动手了
首先我们发现直方图自己就有缩放功能,于是我们看看能不能修改源代码,自己新增一下借口和改一下源代码:
这段代码是在BarLineChartTouchListener类中,处理触摸事件
public boolean onTouch(View v, MotionEvent event) {

        if (mVelocityTracker == null) {
            mVelocityTracker = VelocityTracker.obtain();
        }
        mVelocityTracker.addMovement(event);

        if (event.getActionMasked() == MotionEvent.ACTION_CANCEL) {
            if (mVelocityTracker != null) {
                mVelocityTracker.recycle();
                mVelocityTracker = null;
            }
        }

        if (mTouchMode == NONE) {
            mGestureDetector.onTouchEvent(event);
        }

        if (!mChart.isDragEnabled() && (!mChart.isScaleXEnabled() && !mChart.isScaleYEnabled()))
            return true;

        // Handle touch events here...
        switch (event.getAction() & MotionEvent.ACTION_MASK) {

            case MotionEvent.ACTION_DOWN:

                startAction(event);

                stopDeceleration();

                saveTouchStart(event);

                break;
            case MotionEvent.ACTION_POINTER_DOWN:

                if (event.getPointerCount() >= 2) {

                    mChart.disableScroll();

                    saveTouchStart(event);

                    // get the distance between the pointers on the x-axis
                    mSavedXDist = getXDist(event);

                    // get the distance between the pointers on the y-axis
                    mSavedYDist = getYDist(event);

                    // get the total distance between the pointers
                    mSavedDist = spacing(event);

                    if (mSavedDist > 10f) {

                        if (mChart.isPinchZoomEnabled()) {
                            mTouchMode = PINCH_ZOOM;
                        } else {
                            if (mSavedXDist > mSavedYDist)
                                mTouchMode = X_ZOOM;
                            else
                                mTouchMode = Y_ZOOM;
                        }
                    }

                    // determine the touch-pointer center
                    midPoint(mTouchPointCenter, event);
                }
                break;
            case MotionEvent.ACTION_MOVE:

                if (mTouchMode == DRAG) {

                    mChart.disableScroll();
                    performDrag(event);

                } else if (mTouchMode == X_ZOOM || mTouchMode == Y_ZOOM || mTouchMode == PINCH_ZOOM) {

                    mChart.disableScroll();

                    if (mChart.isScaleXEnabled() || mChart.isScaleYEnabled())
                        performZoom(event);

                } else if (mTouchMode == NONE
                        && Math.abs(distance(event.getX(), mTouchStartPoint.x, event.getY(),
                                mTouchStartPoint.y)) > 5f) {


                    if (mChart.hasNoDragOffset()) {

                        if (!mChart.isFullyZoomedOut() && mChart.isDragEnabled()) {
                            mTouchMode = DRAG;
                        } else {

                            mLastGesture = ChartGesture.DRAG;

                            if (mChart.isHighlightPerDragEnabled())
                                performHighlightDrag(event);
                        }

                    } else if (mChart.isDragEnabled()) {
                        mLastGesture = ChartGesture.DRAG;
                        mTouchMode = DRAG;
                    }
                }
                break;

            case MotionEvent.ACTION_UP:

                final VelocityTracker velocityTracker = mVelocityTracker;
                final int pointerId = event.getPointerId(0);
                velocityTracker.computeCurrentVelocity(1000, Utils.getMaximumFlingVelocity());
                final float velocityY = velocityTracker.getYVelocity(pointerId);
                final float velocityX = velocityTracker.getXVelocity(pointerId);

                if (Math.abs(velocityX) > Utils.getMinimumFlingVelocity() ||
                        Math.abs(velocityY) > Utils.getMinimumFlingVelocity()) {

                    if (mTouchMode == DRAG && mChart.isDragDecelerationEnabled()) {

                        stopDeceleration();

                        mDecelerationLastTime = AnimationUtils.currentAnimationTimeMillis();
                        mDecelerationCurrentPoint = new PointF(event.getX(), event.getY());
                        mDecelerationVelocity = new PointF(velocityX, velocityY);

                        Utils.postInvalidateOnAnimation(mChart); // This causes computeScroll to fire, recommended for this by Google
                    }
                }

                if (mTouchMode == X_ZOOM ||
                        mTouchMode == Y_ZOOM ||
                        mTouchMode == PINCH_ZOOM ||
                        mTouchMode == POST_ZOOM) {

                    // Range might have changed, which means that Y-axis labels
                    // could have changed in size, affecting Y-axis size.
                    // So we need to recalculate offsets.
                    mChart.calculateOffsets();
                    mChart.postInvalidate();
                }

                mTouchMode = NONE;
                mChart.enableScroll();

                if (mVelocityTracker != null) {
                    mVelocityTracker.recycle();
                    mVelocityTracker = null;
                }

                endAction(event);

                break;
            case MotionEvent.ACTION_POINTER_UP:
                Utils.velocityTrackerPointerUpCleanUpIfNecessary(event, mVelocityTracker);

                mTouchMode = POST_ZOOM;
                break;

            case MotionEvent.ACTION_CANCEL:

                mTouchMode = NONE;
                endAction(event);
                break;
        }

        // Perform the transformation, update the chart
        // if (needsRefresh())
        mMatrix = mChart.getViewPortHandler().refresh(mMatrix, mChart, true);

        return true; // indicate event was handled
    }
private void performZoom(MotionEvent event) {

        if (event.getPointerCount() >= 2) {

            OnChartGestureListener l = mChart.getOnChartGestureListener();

            // get the distance between the pointers of the touch
            // event
            float totalDist = spacing(event);

            if (totalDist > 10f) {

                // get the translation
                PointF t = getTrans(mTouchPointCenter.x, mTouchPointCenter.y);

                // take actions depending on the activated touch
                // mode
                if (mTouchMode == PINCH_ZOOM) {

                    mLastGesture = ChartGesture.PINCH_ZOOM;

                    float scale = totalDist / mSavedDist; // total scale

                    boolean isZoomingOut = (scale < 1);
                    boolean canZoomMoreX = isZoomingOut ?
                            mChart.getViewPortHandler().canZoomOutMoreX() :
                            mChart.getViewPortHandler().canZoomInMoreX();

                    float scaleX = (mChart.isScaleXEnabled()) ? scale : 1f;
                    float scaleY = (mChart.isScaleYEnabled()) ? scale : 1f;

                    if (mChart.isScaleYEnabled() || canZoomMoreX) {
                    	Log.v("performZoom", "PINCH_ZOOM :scaleX:"+scaleX+" scaleY "+scaleY);
                        mMatrix.set(mSavedMatrix);
                        mMatrix.postScale(scaleX, scaleY, t.x, t.y);
                        if (l != null){
                        	l.onChartScale(event, scaleX, scaleY);

                        }

                    }

                } else if (mTouchMode == X_ZOOM && mChart.isScaleXEnabled()) {

                    mLastGesture = ChartGesture.X_ZOOM;

                    float xDist = getXDist(event);
                    float scaleX = xDist / mSavedXDist; // x-axis scale

                    boolean isZoomingOut = (scaleX < 1);
                    boolean canZoomMoreX = isZoomingOut ?
                            mChart.getViewPortHandler().canZoomOutMoreX() :
                            mChart.getViewPortHandler().canZoomInMoreX();

                    if (canZoomMoreX) {

                        mMatrix.set(mSavedMatrix);
                        mMatrix.postScale(scaleX, 1f, t.x, t.y);
                        Log.v("performZoom", "scaleX:"+scaleX);
                        Log.v("performZoom", "l!=null:"+(l != null));
                        Log.v("performZoom", "isZoomingOut:"+isZoomingOut);
                        Log.v("performZoom", "canZoomMoreX:"+canZoomMoreX);
                        Log.v("performZoom", "class :"+this.getClass().getName());
                        if (l != null){
                        	l.onChartScale(event, scaleX, 1f);
                        	Log.v("performZoom", "onChartScale :scaleX:"+scaleX);
                        	Log.v("performZoom", "class ::"+this.getClass().getName());
                        }

                    }

                } else if (mTouchMode == Y_ZOOM && mChart.isScaleYEnabled()) {

                    mLastGesture = ChartGesture.Y_ZOOM;

                    float yDist = getYDist(event);
                    float scaleY = yDist / mSavedYDist; // y-axis scale

                    mMatrix.set(mSavedMatrix);

                    // y-axis comes from top to bottom, revert y
                    mMatrix.postScale(1f, scaleY, t.x, t.y);

                    if (l != null)
                        l.onChartScale(event, 1f, scaleY);
                }
            }
        }
}l.onChartScale(event, 1f, scaleY);虽然线索断了,但是也不能就此放弃,这个过程中我们知道了一个单词Zoom,咦,是不是有点熟悉,在BarChart的方法中好像有这些方法,嗯,没错:
/**
     * Zooms in by 1.4f, into the charts center. center.
     */
    public void zoomIn() {
        Matrix save = mViewPortHandler.zoomIn(getWidth() / 2f, -(getHeight() / 2f));
        mViewPortHandler.refresh(save, this, true);

        // Range might have changed, which means that Y-axis labels
        // could have changed in size, affecting Y-axis size.
        // So we need to recalculate offsets.
        calculateOffsets();
        postInvalidate();
    }

    /**
     * Zooms out by 0.7f, from the charts center. center.
     */
    public void zoomOut() {
        Matrix save = mViewPortHandler.zoomOut(getWidth() / 2f, -(getHeight() / 2f));
        mViewPortHandler.refresh(save, this, true);

        // Range might have changed, which means that Y-axis labels
        // could have changed in size, affecting Y-axis size.
        // So we need to recalculate offsets.
        calculateOffsets();
        postInvalidate();
    }

    /**
     * Zooms in or out by the given scale factor. x and y are the coordinates
     * (in pixels) of the zoom center.
     *
     * @param scaleX if < 1f --> zoom out, if > 1f --> zoom in
     * @param scaleY if < 1f --> zoom out, if > 1f --> zoom in
     * @param x
     * @param y
     */
    public void zoom(float scaleX, float scaleY, float x, float y) {
        Matrix save = mViewPortHandler.zoom(scaleX, scaleY, x, -y);
        mViewPortHandler.refresh(save, this, true);

        // Range might have changed, which means that Y-axis labels
        // could have changed in size, affecting Y-axis size.
        // So we need to recalculate offsets.
        calculateOffsets();
        postInvalidate();
    }
(虽然过程似乎超乎意料,但是结果像是也在情理之中,就这样把)
智能推荐
while循环&CPU占用率高问题深入分析与解决方案_main函数使用while(1)循环cpu占用99-程序员宅基地
文章浏览阅读3.8k次,点赞9次,收藏28次。直接上一个工作中碰到的问题,另外一个系统开启多线程调用我这边的接口,然后我这边会开启多线程批量查询第三方接口并且返回给调用方。使用的是两三年前别人遗留下来的方法,放到线上后发现确实是可以正常取到结果,但是一旦调用,CPU占用就直接100%(部署环境是win server服务器)。因此查看了下相关的老代码并使用JProfiler查看发现是在某个while循环的时候有问题。具体项目代码就不贴了,类似于下面这段代码。while(flag) {//your code;}这里的flag._main函数使用while(1)循环cpu占用99
【无标题】jetbrains idea shift f6不生效_idea shift +f6快捷键不生效-程序员宅基地
文章浏览阅读347次。idea shift f6 快捷键无效_idea shift +f6快捷键不生效
node.js学习笔记之Node中的核心模块_node模块中有很多核心模块,以下不属于核心模块,使用时需下载的是-程序员宅基地
文章浏览阅读135次。Ecmacript 中没有DOM 和 BOM核心模块Node为JavaScript提供了很多服务器级别,这些API绝大多数都被包装到了一个具名和核心模块中了,例如文件操作的 fs 核心模块 ,http服务构建的http 模块 path 路径操作模块 os 操作系统信息模块// 用来获取机器信息的var os = require('os')// 用来操作路径的var path = require('path')// 获取当前机器的 CPU 信息console.log(os.cpus._node模块中有很多核心模块,以下不属于核心模块,使用时需下载的是
数学建模【SPSS 下载-安装、方差分析与回归分析的SPSS实现(软件概述、方差分析、回归分析)】_化工数学模型数据回归软件-程序员宅基地
文章浏览阅读10w+次,点赞435次,收藏3.4k次。SPSS 22 下载安装过程7.6 方差分析与回归分析的SPSS实现7.6.1 SPSS软件概述1 SPSS版本与安装2 SPSS界面3 SPSS特点4 SPSS数据7.6.2 SPSS与方差分析1 单因素方差分析2 双因素方差分析7.6.3 SPSS与回归分析SPSS回归分析过程牙膏价格问题的回归分析_化工数学模型数据回归软件
利用hutool实现邮件发送功能_hutool发送邮件-程序员宅基地
文章浏览阅读7.5k次。如何利用hutool工具包实现邮件发送功能呢?1、首先引入hutool依赖<dependency> <groupId>cn.hutool</groupId> <artifactId>hutool-all</artifactId> <version>5.7.19</version></dependency>2、编写邮件发送工具类package com.pc.c..._hutool发送邮件
docker安装elasticsearch,elasticsearch-head,kibana,ik分词器_docker安装kibana连接elasticsearch并且elasticsearch有密码-程序员宅基地
文章浏览阅读867次,点赞2次,收藏2次。docker安装elasticsearch,elasticsearch-head,kibana,ik分词器安装方式基本有两种,一种是pull的方式,一种是Dockerfile的方式,由于pull的方式pull下来后还需配置许多东西且不便于复用,个人比较喜欢使用Dockerfile的方式所有docker支持的镜像基本都在https://hub.docker.com/docker的官网上能找到合..._docker安装kibana连接elasticsearch并且elasticsearch有密码
随便推点
Python 攻克移动开发失败!_beeware-程序员宅基地
文章浏览阅读1.3w次,点赞57次,收藏92次。整理 | 郑丽媛出品 | CSDN(ID:CSDNnews)近年来,随着机器学习的兴起,有一门编程语言逐渐变得火热——Python。得益于其针对机器学习提供了大量开源框架和第三方模块,内置..._beeware
Swift4.0_Timer 的基本使用_swift timer 暂停-程序员宅基地
文章浏览阅读7.9k次。//// ViewController.swift// Day_10_Timer//// Created by dongqiangfei on 2018/10/15.// Copyright 2018年 飞飞. All rights reserved.//import UIKitclass ViewController: UIViewController { ..._swift timer 暂停
元素三大等待-程序员宅基地
文章浏览阅读986次,点赞2次,收藏2次。1.硬性等待让当前线程暂停执行,应用场景:代码执行速度太快了,但是UI元素没有立马加载出来,造成两者不同步,这时候就可以让代码等待一下,再去执行找元素的动作线程休眠,强制等待 Thread.sleep(long mills)package com.example.demo;import org.junit.jupiter.api.Test;import org.openqa.selenium.By;import org.openqa.selenium.firefox.Firefox.._元素三大等待
Java软件工程师职位分析_java岗位分析-程序员宅基地
文章浏览阅读3k次,点赞4次,收藏14次。Java软件工程师职位分析_java岗位分析
Java:Unreachable code的解决方法_java unreachable code-程序员宅基地
文章浏览阅读2k次。Java:Unreachable code的解决方法_java unreachable code
标签data-*自定义属性值和根据data属性值查找对应标签_如何根据data-*属性获取对应的标签对象-程序员宅基地
文章浏览阅读1w次。1、html中设置标签data-*的值 标题 11111 222222、点击获取当前标签的data-url的值$('dd').on('click', function() { var urlVal = $(this).data('ur_如何根据data-*属性获取对应的标签对象