Win32 SDK Gui编程系列之--折线图Chart-程序员宅基地
技术标签: c++ C c语言 工具 Win32 SDK Gui C/C++ windows 开发语言
折线图Chart
在这里,虽然不是以通用程序为目标,但稍微变更一下就可以用于其他用途。因此,作为图表的绘制区域,左下方的原点坐标为(0.0,0.0),右上角的坐标为(1.0,1.0)进行正规化。但是,这是X、Y的值是非负值的情况,处理负值时,原点的位置会移动。
Chart01.c
// 折线图
// tcc chart01.c ../lib/winlib.o

#include <windows.h>
#include <time.h>
#include <sys/stat.h>

enum MARGIN { LEFT = 50, TOP = 26, RIGHT = 70, BOTTOM = 24 };

RECT rect;		        // 窗口客户端区域
int width, height;  	// 图形绘制区域的宽度和高度
double* data;
int nData;
struct tm  tmBgn;	    // 开始日期
double vMax = 1000.0;
double vMin = 0.0;

int nx(double x) { return (int)(rect.left + LEFT + x*width + 0.5); }
int ny(double y) { return (int)(rect.top + TOP + (1.0-y)*height + 0.5); }
int yVal(double v){ return ny((v - vMin)/(vMax - vMin)); }

HWND crWindow(HINSTANCE, LPSTR, WNDPROC, int, int, int, int);

void setData(HWND hWnd) {
    char path[256], buf[256];
    time_t t, timeNow = time(NULL);
    int n;

    memset(&tmBgn, 0, sizeof(tmBgn));	// 零清除
    tmBgn.tm_year = 2011 - 1900;	    // 2011年
    tmBgn.tm_mon  =    9 - 1;	    	// 9月
    tmBgn.tm_mday =    4;		        // 4日(周日)
    t = mktime(&tmBgn);
    nData = (timeNow - t)/(24*60*60);
    data = (double*)calloc(nData, sizeof(double));
    for (n = 0; n < nData; n++) {
	struct stat buf;
	struct tm *tm = localtime(&t);
	wsprintf(path, "c:/Temp/www-access-log/access%d%02d%02d.txt",
			tm->tm_year+1900, tm->tm_mon+1, tm->tm_mday);
	stat(path, &buf);
	data[n] = (double)buf.st_size/1000.0;
	t += 24 * 60 * 60;
    }
}

void paint(HWND hwnd){
    int n;
    double x, y, xLast, yLast;
    char buf[32];
    RECT rc;
    PAINTSTRUCT ps;
    HDC hdc = BeginPaint(hwnd, &ps);
    time_t t;

    GetClientRect(hwnd, &rect);
    width  = (rect.right - rect.left) - LEFT - RIGHT;
    height = (rect.bottom - rect.top) - TOP - BOTTOM;
    SetRect(&rc, nx(0.0), 0, nx(1.0), ny(1.0));
    DrawText(hdc, "访问日志文件大小(KB)", -1, &rc, DT_CENTER | DT_SINGLELINE | DT_VCENTER);
    for (n = 0; n <= 5; n++) {		// Y轴
	y = (double)n / 5;
	MoveToEx(hdc, nx(0.0), ny(y), NULL);
	LineTo(hdc, nx(1.0)+6, ny(y));
	sprintf(buf, "%d", n*1000/5);
	SetRect(&rc, nx(1.0), ny(y)-10, nx(1.0)+60, ny(y)+10);
        DrawText(hdc, buf, -1, &rc, DT_CENTER | DT_SINGLELINE | DT_VCENTER);
    }
    t = mktime(&tmBgn);
    for (n = 0; n < nData; n+=7) {	// X轴
	struct tm *tm = localtime(&t);
	x = (n + 0.5) / nData;
	MoveToEx(hdc, nx(x), ny(0.0), NULL);
	LineTo(hdc, nx(x), ny(1.0));
	SetRect(&rc, nx(x)-50, ny(0), nx(x)+50, ny(0)+24);
	wsprintf(buf, "%d-%02d-%02d", tm->tm_year+1900, tm->tm_mon+1, tm->tm_mday);
        DrawText(hdc, buf, -1, &rc, DT_CENTER | DT_SINGLELINE | DT_VCENTER);
	t += 7 * 24 * 60 * 60;
    }
    xLast = 0.5 / nData;
    yLast = yVal(data[0]);
    MoveToEx(hdc, nx(xLast), yLast, NULL);
    for (n = 1; n < nData; n++) {	 // 折线图
	x = (n + 0.5) / nData;
	y = yVal(data[n]);
	LineTo(hdc, nx(x), y);
	xLast = x;
	yLast = y;
    }
    EndPaint(hwnd, &ps);
}

LRESULT CALLBACK WindowProc(HWND hwnd, UINT uMsg, WPARAM wParam, LPARAM lParam) {
    switch (uMsg) {
    case WM_PAINT:   paint(hwnd);  break;
    case WM_DESTROY: PostQuitMessage(0); break;
    default: return DefWindowProc(hwnd, uMsg, wParam, lParam);
    }
    return 0;
}

int WINAPI WinMain(HINSTANCE hInstance, HINSTANCE hPrevInstance, LPSTR lpCmdLine, int nCmdShow) {
    HWND hWnd = crWindow(hInstance, TEXT("Chart"), WindowProc, 10, 10, 800, 300);
    if (!hWnd) return FALSE;
    SetWindowText(hWnd, TEXT("Chart01"));
    setData(hWnd);
    return msgLoop();
}
这个项目的实施结果如下图所示。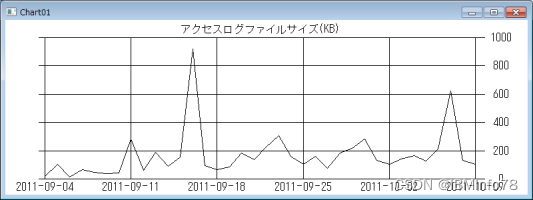
在访问量的推移图中追加移动平均。
在前节的图表中,追加7天移动平均的程序如下所示。
Chart02.c
// 折线图。 在chart01.c添加移动平均值。
// tcc chart02.c ../lib/winlib.o

#include <windows.h>
#include <time.h>
#include <sys/stat.h>

enum MARGIN { LEFT = 50, TOP = 26, RIGHT = 70, BOTTOM = 24 };

RECT rect;		// 窗口客户端区域
int width, height;  	// 图形绘制区域的宽度和高度
double* data;
double* mvavg;		 // 移动平均(7天)数据
int nData;
struct tm  tmBgn;	// 开始日期
double vMax = 1000.0;
double vMin = 0.0;

int nx(double x) { return (int)(rect.left + LEFT + x*width + 0.5); }
int ny(double y) { return (int)(rect.top + TOP + (1.0-y)*height + 0.5); }
int yVal(double v){ return ny((v - vMin)/(vMax - vMin)); }

HWND crWindow(HINSTANCE, LPSTR, WNDPROC, int, int, int, int);

void setData(HWND hWnd) {
    double sum;		// 移动平均
    char path[256], buf[256];
    time_t t, timeNow = time(NULL);
    int n;

    memset(&tmBgn, 0, sizeof(tmBgn));	 // 零清除
    tmBgn.tm_year = 2011 - 1900;	 // 2011年
    tmBgn.tm_mon  =    9 - 1;		// 9月
    tmBgn.tm_mday =    4;		 // 4日(周日)
    t = mktime(&tmBgn);
    nData = (timeNow - t)/(24*60*60);
    data  = (double*)calloc(nData, sizeof(double));
    mvavg = (double*)calloc(nData, sizeof(double));
    sum = 0.0;
    for (n = 0; n < nData; n++) {
	struct stat buf;
	struct tm *tm = localtime(&t);
	wsprintf(path, "c:/Temp/www-access-log/access%d%02d%02d.txt",
			tm->tm_year+1900, tm->tm_mon+1, tm->tm_mday);
	stat(path, &buf);
	data[n] = (double)buf.st_size/1000.0;
	t += 24 * 60 * 60;
	sum += data[n];
	if (n >= 7) sum -= data[n-7];
	mvavg[n] = sum / 7;
    }
}

void paint(HWND hwnd){
    int n;
    double x, y, xLast, yLast;
    char buf[32];
    RECT rc;
    PAINTSTRUCT ps;
    HDC hdc = BeginPaint(hwnd, &ps);
    HPEN hPen, hOldPen;
    time_t t;

    GetClientRect(hwnd, &rect);
    width  = (rect.right - rect.left) - LEFT - RIGHT;
    height = (rect.bottom - rect.top) - TOP - BOTTOM;
    SetRect(&rc, nx(0.0), 0, nx(1.0), ny(1.0));
    DrawText(hdc, "访问日志文件大小(KB)", -1, &rc, DT_CENTER | DT_SINGLELINE | DT_VCENTER);
    for (n = 0; n <= 5; n++) {		 // Y轴
	y = (double)n / 5;
	MoveToEx(hdc, nx(0.0), ny(y), NULL);
	LineTo(hdc, nx(1.0)+6, ny(y));
	sprintf(buf, "%d", n*1000/5);
	SetRect(&rc, nx(1.0), ny(y)-10, nx(1.0)+60, ny(y)+10);
        DrawText(hdc, buf, -1, &rc, DT_CENTER | DT_SINGLELINE | DT_VCENTER);
    }
    t = mktime(&tmBgn);
    for (n = 0; n < nData; n+=7) {	// X轴
	struct tm *tm = localtime(&t);
	x = (n + 0.5) / nData;
	MoveToEx(hdc, nx(x), ny(0.0), NULL);
	LineTo(hdc, nx(x), ny(1.0));
	SetRect(&rc, nx(x)-50, ny(0), nx(x)+50, ny(0)+24);
	wsprintf(buf, "%d-%02d-%02d", tm->tm_year+1900, tm->tm_mon+1, tm->tm_mday);
        DrawText(hdc, buf, -1, &rc, DT_CENTER | DT_SINGLELINE | DT_VCENTER);
	t += 7 * 24 * 60 * 60;
    }

    xLast = 0.5 / nData;
    yLast = yVal(data[0]);
    MoveToEx(hdc, nx(xLast), yLast, NULL);
    for (n = 1; n < nData; n++) {	// 折线图
	x = (n + 0.5) / nData;
	y = yVal(data[n]);
	LineTo(hdc, nx(x), y);
	xLast = x;
	yLast = y;
    }

    // 绘制移动平均图
    hPen = CreatePen(PS_SOLID, 2, 0xFF);	// RED
    hOldPen = SelectObject(hdc, hPen);
    xLast = 6.5 / nData;
    yLast = yVal(mvavg[6]);
    MoveToEx(hdc, nx(xLast), yLast, NULL);
    for (n = 7; n < nData; n++) {	// 折线图
	x = (n + 0.5) / nData;
	y = yVal(mvavg[n]);
	LineTo(hdc, nx(x), y);
	xLast = x;
	yLast = y;
    }
    SelectObject(hdc, hOldPen);
    DeleteObject(hPen);

    EndPaint(hwnd, &ps);
}

LRESULT CALLBACK WindowProc(HWND hwnd, UINT uMsg, WPARAM wParam, LPARAM lParam) {
    switch (uMsg) {
    case WM_PAINT:   paint(hwnd);  break;
    case WM_DESTROY: PostQuitMessage(0); break;
    default: return DefWindowProc(hwnd, uMsg, wParam, lParam);
    }
    return 0;
}

int WINAPI WinMain(HINSTANCE hInstance, HINSTANCE hPrevInstance, LPSTR lpCmdLine, int nCmdShow) {
    HWND hWnd = crWindow(hInstance, TEXT("Chart"), WindowProc, 10, 10, 800, 300);
    if (!hWnd) return FALSE;
    SetWindowText(hWnd, TEXT("Chart02"));
    setData(hWnd);
    return msgLoop();
}
这个项目的实施结果如下图所示。
求7天的移动平均(红色)的话,根据星期的变动会被吸收,变成非常光滑的折线图。
单对数图
当Y轴的数值波动很大时,只把Y轴做成对数的单对数图(下图)是有效的。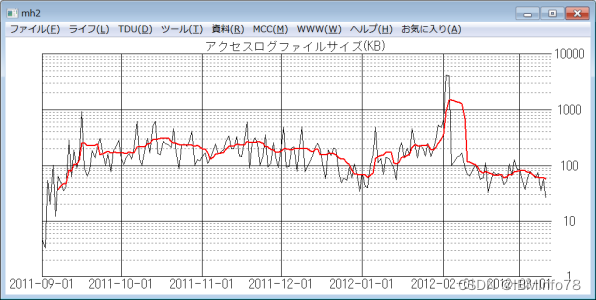
节目如下所示。drawLogGraph函数是单对数图的绘图函数,是drawLinearGraph函数之前显示的线性(比例)刻度图的绘图函数。
Graph01.c
// 折线图。
// mcc -shared graph01.c

#include <windows.h>
#include <math.h>
#include <stdio.h>
#include <stdlib.h>
#include <string.h>
#include <time.h>
#include <sys/stat.h>

#define EXPORT __declspec(dllexport)

#define LEFT  	60
#define TOP   	26
#define RIGHT 	70
#define BOTTOM 	30

RECT rect;		// 窗口客户端区域
int width, height;  	// 图形绘制区域的宽度和高度
double* data;
double* mvavg;		// 移动平均(7天)数据
int nData;
struct tm  tmBgn;	// 开始日期
double vMax;
double vMin;
void *null = 0;

int nx(double x) { return (int)(rect.left + LEFT + x*width + 0.5); }
int ny(double y) { return (int)(rect.top + TOP + (1.0-y)*height + 0.5); }
double yVal(double v){
    return (double)ny((log10(v) - log10(vMin))/(log10(vMax) - log10(vMin)));
}

EXPORT void setData() {
    double sum;		// 移动平均
    char path[256], buf[256];
    time_t t, timeNow = time(NULL);
    int n;
    int factor;

    memset(&tmBgn, 0, sizeof(tmBgn));	// 零清除
    tmBgn.tm_year = 2011 - 1900;	// 2011年
    tmBgn.tm_mon  =    9 - 1;		// 9月
    tmBgn.tm_mday =    1;		 // 1天
    t = mktime(&tmBgn);
    nData = (timeNow - t)/(24*60*60);
    data  = calloc(nData, sizeof(double));
    mvavg = calloc(nData, sizeof(double));
    sum = 0.0;
    for (n = 0; n < nData; n++) {
	struct _stat buf;
	struct tm *tm = localtime(&t);
	wsprintf(path, "c:/Temp/www-access-log/access%d%02d%02d.txt",
			tm->tm_year+1900, tm->tm_mon+1, tm->tm_mday);
	_stat(path, &buf);
	data[n] = (double)buf.st_size/1000.0;
	if (data[n] == 0) break;
	if (n == 0) {
	    vMax = data[n];
	    vMin = data[n];
	} else {
	    if (data[n] > vMax) vMax = data[n];
	    if (data[n] < vMin) vMin = data[n];
	}
	t += 24 * 60 * 60;
	sum += data[n];
	if (n >= 7) sum -= data[n-7];
	mvavg[n] = sum / 7;	// 7天的移动平均
    }
    nData = n;
    vMin = pow(10.0, floor(log10(vMin < 1.0 ? 1.0 : vMin)));
    vMax = pow(10.0, ceil(log10(vMax)));
}

// 纵轴(日志大小)为对数大小(片对数图)
EXPORT void drawLogGraph(HWND hwnd) {
    int n, k, nY;
    double x, y, xLast, yLast, yBase;
    char buf[256];
    RECT rc;
    PAINTSTRUCT ps;
    HDC hdc = BeginPaint(hwnd, &ps);
    HPEN hPen, hOldPen;
    time_t t;
    int DAYS = 30;
    int NY = (int)(log10(vMax) - log10(vMin));

    GetClientRect(hwnd, &rect);
    width  = (rect.right - rect.left) - LEFT - RIGHT;
    height = (rect.bottom - rect.top) - TOP - BOTTOM;
    SetRect(&rc, nx(0.0), 0, nx(1.0), ny(1.0));
    DrawText(hdc, "访问日志文件大小(KB)",
		-1, &rc, DT_CENTER | DT_SINGLELINE | DT_VCENTER);
    for (n = 0; n <= NY; n++) {		// Y轴
	y = (double)n / NY;
	MoveToEx(hdc, nx(0.0), ny(y), NULL);
	LineTo(hdc, nx(1.0)+6, ny(y));
	sprintf(buf, "%.0f", vMin*pow(10.0, (double)n));
	SetRect(&rc, nx(1.0), ny(y)-10, nx(1.0)+70, ny(y)+10);
        DrawText(hdc, buf, -1, &rc, DT_CENTER | DT_SINGLELINE | DT_VCENTER);
    }

    // Y轴方向辅助划线
    hPen = CreatePen(PS_DOT, 1, 0x808080);
    hOldPen = SelectObject(hdc, hPen);
    nY = (int)vMin;
    for (n = 0; n < NY; n++) {		// Y轴
	yBase = vMin * pow(10.0, (double)n);
	for (k = 2; k < 10; k++) {
	    y = yBase * k;
	    MoveToEx(hdc, nx(0.0), (int)yVal(y), NULL);
	    LineTo(hdc, nx(1.0)+6, (int)yVal(y));
	}
    }
    SelectObject(hdc, hOldPen);
    DeleteObject(hPen);

    t = mktime(&tmBgn);
    for (n = 0; n < nData; n++) {	// X轴
	struct tm *tm = localtime(&t);
	if (tm->tm_mday == 1) {
	    x = (double)n / nData;
	    MoveToEx(hdc, nx(x), ny(0.0), NULL);
	    LineTo(hdc, nx(x), ny(1.0));
	    SetRect(&rc, nx(x)-60, ny(0.0), nx(x)+60, ny(0.0)+24);
	    wsprintf(buf, "%d-%02d-%02d", tm->tm_year+1900, tm->tm_mon+1, tm->tm_mday);
            DrawText(hdc, buf, -1, &rc, DT_CENTER | DT_SINGLELINE | DT_VCENTER);
	}
	t += 24 * 60 * 60;
    }

    xLast = 0.0;
    yLast = yVal(data[0]);
    MoveToEx(hdc, nx(xLast), (int)yLast, null);
    for (n = 1; n < nData; n++) {	// 折线图
	x = (double)n / nData;
	y = yVal(data[n]);
	LineTo(hdc, nx(x), (int)y);
	xLast = x;
	yLast = y;
    }

    // 绘制移动平均图
    hPen = CreatePen(PS_SOLID, 2, 0xFF);	// RED
    hOldPen = SelectObject(hdc, hPen);
    xLast = 6.0 / nData;
    yLast = yVal(mvavg[6]);
    MoveToEx(hdc, nx(xLast), (int)yLast, null);
    for (n = 7; n < nData; n++) {	 // 折线图
	x = (double)n / nData;
	y = yVal(mvavg[n]);
	LineTo(hdc, nx(x), (int)y);
	xLast = x;
	yLast = y;
    }
    SelectObject(hdc, hOldPen);
    DeleteObject(hPen);

    EndPaint(hwnd, &ps);
}

EXPORT void drawLinearGraph(HWND hwnd) {
    int n;
    double x, y, xLast, yLast;
    char buf[32];
    RECT rc;
    PAINTSTRUCT ps;
    HDC hdc = BeginPaint(hwnd, &ps);
    HPEN hPen, hOldPen;
    time_t t;
    int DAYS = 30;

    GetClientRect(hwnd, &rect);
    width  = (rect.right - rect.left) - LEFT - RIGHT;
    height = (rect.bottom - rect.top) - TOP - BOTTOM;
    SetRect(&rc, nx(0.0), 0, nx(1.0), ny(1.0));
    DrawText(hdc, "访问日志文件大小(KB)",
		-1, &rc, DT_CENTER | DT_SINGLELINE | DT_VCENTER);
    for (n = 0; n <= 5; n++) {		// Y轴
	y = (double)n / 5;
	MoveToEx(hdc, nx(0.0), ny(y), NULL);
	LineTo(hdc, nx(1.0)+6, ny(y));
	sprintf(buf, "%.0f", n*vMax/5);
	SetRect(&rc, nx(1.0), ny(y)-10, nx(1.0)+60, ny(y)+10);
        DrawText(hdc, buf, -1, &rc, DT_CENTER | DT_SINGLELINE | DT_VCENTER);
    }
    t = mktime(&tmBgn);
    for (n = 0; n < nData; n+=DAYS) {	// X轴
	struct tm *tm = localtime(&t);
	x = (n + 0.5) / nData;
	MoveToEx(hdc, nx(x), ny(0.0), NULL);
	LineTo(hdc, nx(x), ny(1.0));
	SetRect(&rc, nx(x)-60, ny(0.0), nx(x)+60, ny(0.0)+24);
	wsprintf(buf, "%d-%02d-%02d", tm->tm_year+1900, tm->tm_mon+1, tm->tm_mday);
        DrawText(hdc, buf, -1, &rc, DT_CENTER | DT_SINGLELINE | DT_VCENTER);
	t += DAYS * 24 * 60 * 60;
    }

    xLast = 0.5 / nData;
    yLast = yVal(data[0]);
    MoveToEx(hdc, nx(xLast), (int)yLast, null);
    for (n = 1; n < nData; n++) {	// 折线图
	x = (n + 0.5) / nData;
	y = yVal(data[n]);
	LineTo(hdc, nx(x), (int)y);
	xLast = x;
	yLast = y;
    }

    // 绘制移动平均图
    hPen = CreatePen(PS_SOLID, 2, 0xFF);	// RED
    hOldPen = SelectObject(hdc, hPen);
    xLast = 6.5 / nData;
    yLast = yVal(mvavg[6]);
    MoveToEx(hdc, nx(xLast), (int)yLast, null);
    for (n = 7; n < nData; n++) {	// 折线图
	x = (n + 0.5) / nData;
	y = yVal(mvavg[n]);
	LineTo(hdc, nx(x), (int)y);
	xLast = x;
	yLast = y;
    }
    SelectObject(hdc, hOldPen);
    DeleteObject(hPen);

    EndPaint(hwnd, &ps);
}
智能推荐
海康威视网络摄像头开发流程(五)------- 直播页面测试_ezuikit 测试的url-程序员宅基地
文章浏览阅读3.8k次。1、将下载好的萤石js插件,添加到SoringBoot项目中。位置可参考下图所示。(容易出错的地方,在将js插件在html页面引入时,发生路径错误的问题)所以如果对页面中引入js的路径不清楚,可参考下图所示存放路径。2、将ezuikit.js引入到demo-live.html中。(可直接将如下代码复制到你创建的html页面中)<!DOCTYPE html><html lan..._ezuikit 测试的url
如何确定组态王与多动能RTU的通信方式_组态王ua-程序员宅基地
文章浏览阅读322次。第二步,在弹出的对话框选择,设备驱动—>PLC—>莫迪康—>ModbusRTU—>COM,根据配置软件选择的协议选期期,这里以此为例,然后点击“下一步”。第四步,把使用虚拟串口打勾(GPRS设备),根据需要选择要生成虚拟口,这里以选择KVCOM1为例,然后点击“下一步”设备ID即Modbus地址(1-255) 使用DTU时,为下485接口上的设备地址。第六步,Modbus的从机地址,与配置软件相同,这里以1为例,点击“下一步“第五步,Modbus的从机地址,与配置软件相同,这里以1为例,点击“下一步“_组态王ua
npm超详细安装(包括配置环境变量)!!!npm安装教程(node.js安装教程)_npm安装配置-程序员宅基地
文章浏览阅读9.4k次,点赞22次,收藏19次。安装npm相当于安装node.js,Node.js已自带npm,安装Node.js时会一起安装,npm的作用就是对Node.js依赖的包进行管理,也可以理解为用来安装/卸载Node.js需要装的东西_npm安装配置
火车头采集器AI伪原创【php源码】-程序员宅基地
文章浏览阅读748次,点赞21次,收藏26次。大家好,小编来为大家解答以下问题,python基础训练100题,python入门100例题,现在让我们一起来看看吧!宝子们还在新手村练级的时候,不单要吸入基础知识,夯实自己的理论基础,还要去实际操作练练手啊!由于文章篇幅限制,不可能将100道题全部呈现在此除了这些,下面还有我整理好的基础入门学习资料,视频和讲解文案都很齐全,用来入门绝对靠谱,需要的自提。保证100%免费这不,贴心的我爆肝给大家整理了这份今天给大家分享100道Python练习题。大家一定要给我三连啊~
Linux Ubuntu 安装 Sublime Text (无法使用 wget 命令,使用安装包下载)_ubuntu 安装sumlime text打不开-程序员宅基地
文章浏览阅读1k次。 为了在 Linux ( Ubuntu) 上安装sublime,一般大家都会选择常见的教程或是 sublime 官网教程,然而在国内这种方法可能失效。为此,需要用安装包安装。以下就是使用官网安装包安装的教程。打开 sublime 官网后,点击右上角 download, 或是直接访问点击打开链接,即可看到各个平台上的安装包。选择 Linux 64 位版并下载。下载后,打开终端,进入安装..._ubuntu 安装sumlime text打不开
CrossOver for Mac 2024无需安装 Windows 即可以在 Mac 上运行游戏 Mac运行exe程序和游戏 CrossOver虚拟机 crossover运行免安装游戏包-程序员宅基地
文章浏览阅读563次,点赞13次,收藏6次。CrossOver24是一款类虚拟机软件,专为macOS和Linux用户设计。它的核心技术是Wine,这是一种在Linux和macOS等非Windows操作系统上运行Windows应用程序的开源软件。通过CrossOver24,用户可以在不购买Windows授权或使用传统虚拟机的情况下,直接在Mac或Linux系统上运行Windows软件和游戏。该软件还提供了丰富的功能,如自动配置、无缝集成和实时传输等,以实现高效的跨平台操作体验。
随便推点
一个用聊天的方式让ChatGPT写的线程安全的环形List_为什么gpt一写list就卡-程序员宅基地
文章浏览阅读1.7k次。一个用聊天的方式让ChatGPT帮我写的线程安全的环形List_为什么gpt一写list就卡
Tomcat自带的设置编码Filter-程序员宅基地
文章浏览阅读336次。我们在前面的文章里曾写过Web应用中乱码产生的原因和处理方式,旧文回顾:深度揭秘乱码问题背后的原因及解决方式其中我们提到可以通过Filter的方式来设置请求和响应的encoding,来解..._filterconfig selectencoding
javascript中encodeURI和decodeURI方法使用介绍_js encodeur decodeurl-程序员宅基地
文章浏览阅读651次。转自:http://www.jb51.net/article/36480.htmencodeURI和decodeURI是成对来使用的,因为浏览器的地址栏有中文字符的话,可以会出现不可预期的错误,所以可以encodeURI把非英文字符转化为英文编码,decodeURI可以用来把字符还原回来_js encodeur decodeurl
Android开发——打包apk遇到The destination folder does not exist or is not writeable-程序员宅基地
文章浏览阅读1.9w次,点赞6次,收藏3次。前言在日常的Android开发当中,我们肯定要打包apk。但是今天我打包的时候遇到一个很奇怪的问题Android The destination folder does not exist or is not writeable,大意是目标文件夹不存在或不可写。出现问题的原因以及解决办法上面有说报错的中文大意是:目标文件夹不存在或不可写。其实问题就在我们的打包界面当中图中标红的Desti..._the destination folder does not exist or is not writeable
Eclipse配置高大上环境-程序员宅基地
文章浏览阅读94次。一、配置代码编辑区的样式 <1>打开Eclipse,Help —> Install NewSoftware,界面如下: <2>点击add...,按下图所示操作: name:随意填写,Location:http://eclipse-color-th..._ecplise高大上设置
Linux安装MySQL-5.6.24-1.linux_glibc2.5.x86_64.rpm-bundle.tar_linux mysql 安装 mysql-5.6.24-1.linux_glibc2.5.x86_6-程序员宅基地
文章浏览阅读2.8k次。一,下载mysql:http://dev.mysql.com/downloads/mysql/; 打开页面之后,在Select Platform:下选择linux Generic,如果没有出现Linux的选项,请换一个浏览器试试。我用的谷歌版本不可以,换一个别的浏览器就行了,如果还是不行,需要换一个翻墙的浏览器。 二,下载完后解压缩并放到安装文件夹下: 1、MySQL-client-5.6.2_linux mysql 安装 mysql-5.6.24-1.linux_glibc2.5.x86_64.rpm-bundle